

Asset class recap for June
June was a mixed month for the equity asset classes in our table below. Price momentum continued for technology related stocks while results were mixed for other sectors. Interest rates dropped slightly, pushing fixed income prices and total returns up for bond indexes across the board.

For the second quarter of 2024, large growth stocks and emerging market stocks produced positive returns while value stocks, smaller cap stocks, and developed market international stocks had price declines. For the individual stocks that make up the S&P 500 index, returns continued to be highly skewed toward Artificial Intelligence related stocks with large market capitalizations. The market cap weighted total return for the S&P 500 was 4.28% in Q2 but the median return for all of the underlying stocks was a shockingly lower -3.10%. Only 26% of the underlying stocks in the S&P 500 index had returns above the weighted average of 4.28%, while 74% of the stocks returned less than 4.28%. Outsized returns have been focused on mega-cap stocks.
Emerging market stock indexes hold relatively high weightings in technology related stocks, which helped boost returns for in Q2. For the quarter, emerging market stocks Taiwan Semiconductor had a return of 24.9%, Infosys Ltd ADR had a return of 5.7%, and MediaTek had a return of 18.1%.
During the second quarter, interest rates climbed slightly for intermediate and longer dated bonds, resulting in price declines for both, and leading long-term bonds to have negative total returns and intermediate bonds to have nearly flat total returns (after adding in positive returns for coupon payments). High yield bonds have benefited from low default rates as the overall economy has been very steady.
It is common for growth and value stocks to trade leadership for extended periods of time. The chart below shows historical stretches during which growth and value stocks have each had multi-year stretches of outperforming the other. The chart shows the cumulative outperformance if you reset your portfolio to neutral each day (the trends are not geometrically compounded for this chart). Aside from the relatively short period when value dropped less than growth during the market pullback in 2022, growth stocks have been on a very strong run since 2007.
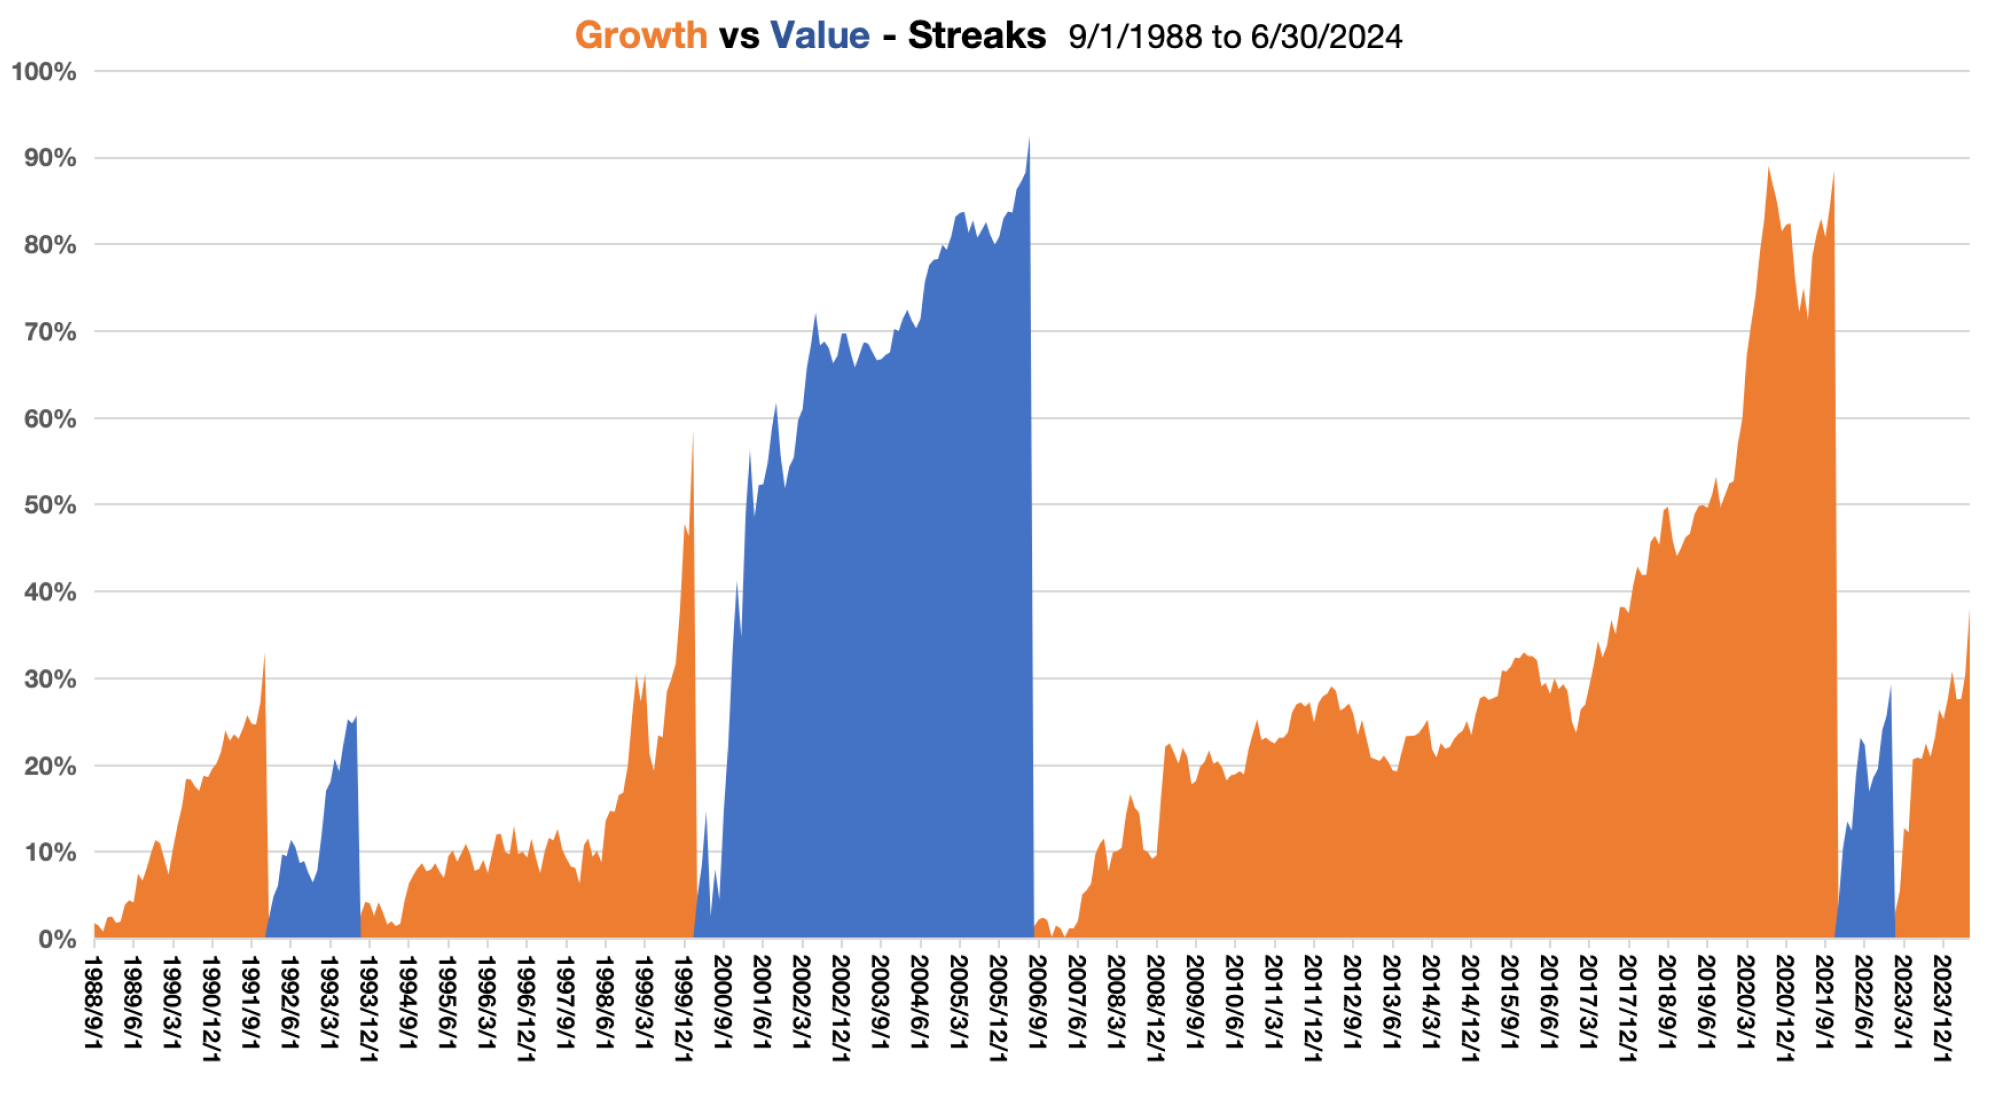
According to https://investor.vanguard.com, the P/E ratio for Vanguard Growth ETF (ticker: VUG) is 36.9 at the end of June, while the P/E ratio for Vanguard Value ETF (ticker: VTV) is 19.5. That is a very wide spread in P/E ratios compared to historical norms. As growth momentum has been driving valuations higher and higher for technology stocks, the current market setup is looking more and more like what we saw in 1999 during the dotcom bubble. An increasing number of macroeconomists are predicting that value is likely to outperform growth during the next couple years.
Among U.S. equity sectors, Q2 returns followed the same pattern we have seen during the last year, with technology stocks leading the way. Multiple tech companies now have total market capitalizations over $3 trillion. The utilities sector was up overall, as a few utilities companies caught a tailwind on expected increased revenues from sales to A.I. data centers. Energy prices dropped slightly, pushing energy sector stock prices down. Oil is right on top of the $80 / barrel price that has been the median price since 2007, however, many production costs have increased in line with recent inflation. Materials stocks were also down this quarter, with increasing debt servicing costs taking a big bite out of profits for materials firms like Linde and Air Products and Chemicals. The interest expense on their relatively large debt loads has more than doubled over the last few years – tripling for some firms as outstanding debt matures and must be reissued at prevailing higher rates.

U.S. Spending vs Taxing
One of the most significant threats to both stock and bond markets is the U.S. federal debt and ongoing massive borrowing. The ballooning deficit and the interest payments that come with it are eating increasingly into our ability to spend on the services and goods that the government is responsible for. Spending on the annual interest expense for our debt recently surpassed the amount we pay each year on defense spending, demonstrating the severity of the problem.
For decades, there has been debate in Washington, among academics, and between investors, about how much debt could be run up in the U.S. before it became a problem. There have been extremists on both sides of the debate that make it easy to ignore the issue. When interest rates on new U.S. debt ran between roughly 0.5% and 2% from 2011 to 2022, lawmakers became more and more aggressive with deficit spending because the impact on interest expenditure was not large. “Modern Monetary Theory” (MMT) proponents have been suggesting that the U.S. could run up an unlimited amount of debt without ever worrying about repercussions. “Debt hawk” Bill Gross, who was recognized twenty years ago as the Bond King from PIMCO suggested in 2011 that the U.S. was in danger of defaulting on its debt and took an unfortunate short position in U.S. treasuries.
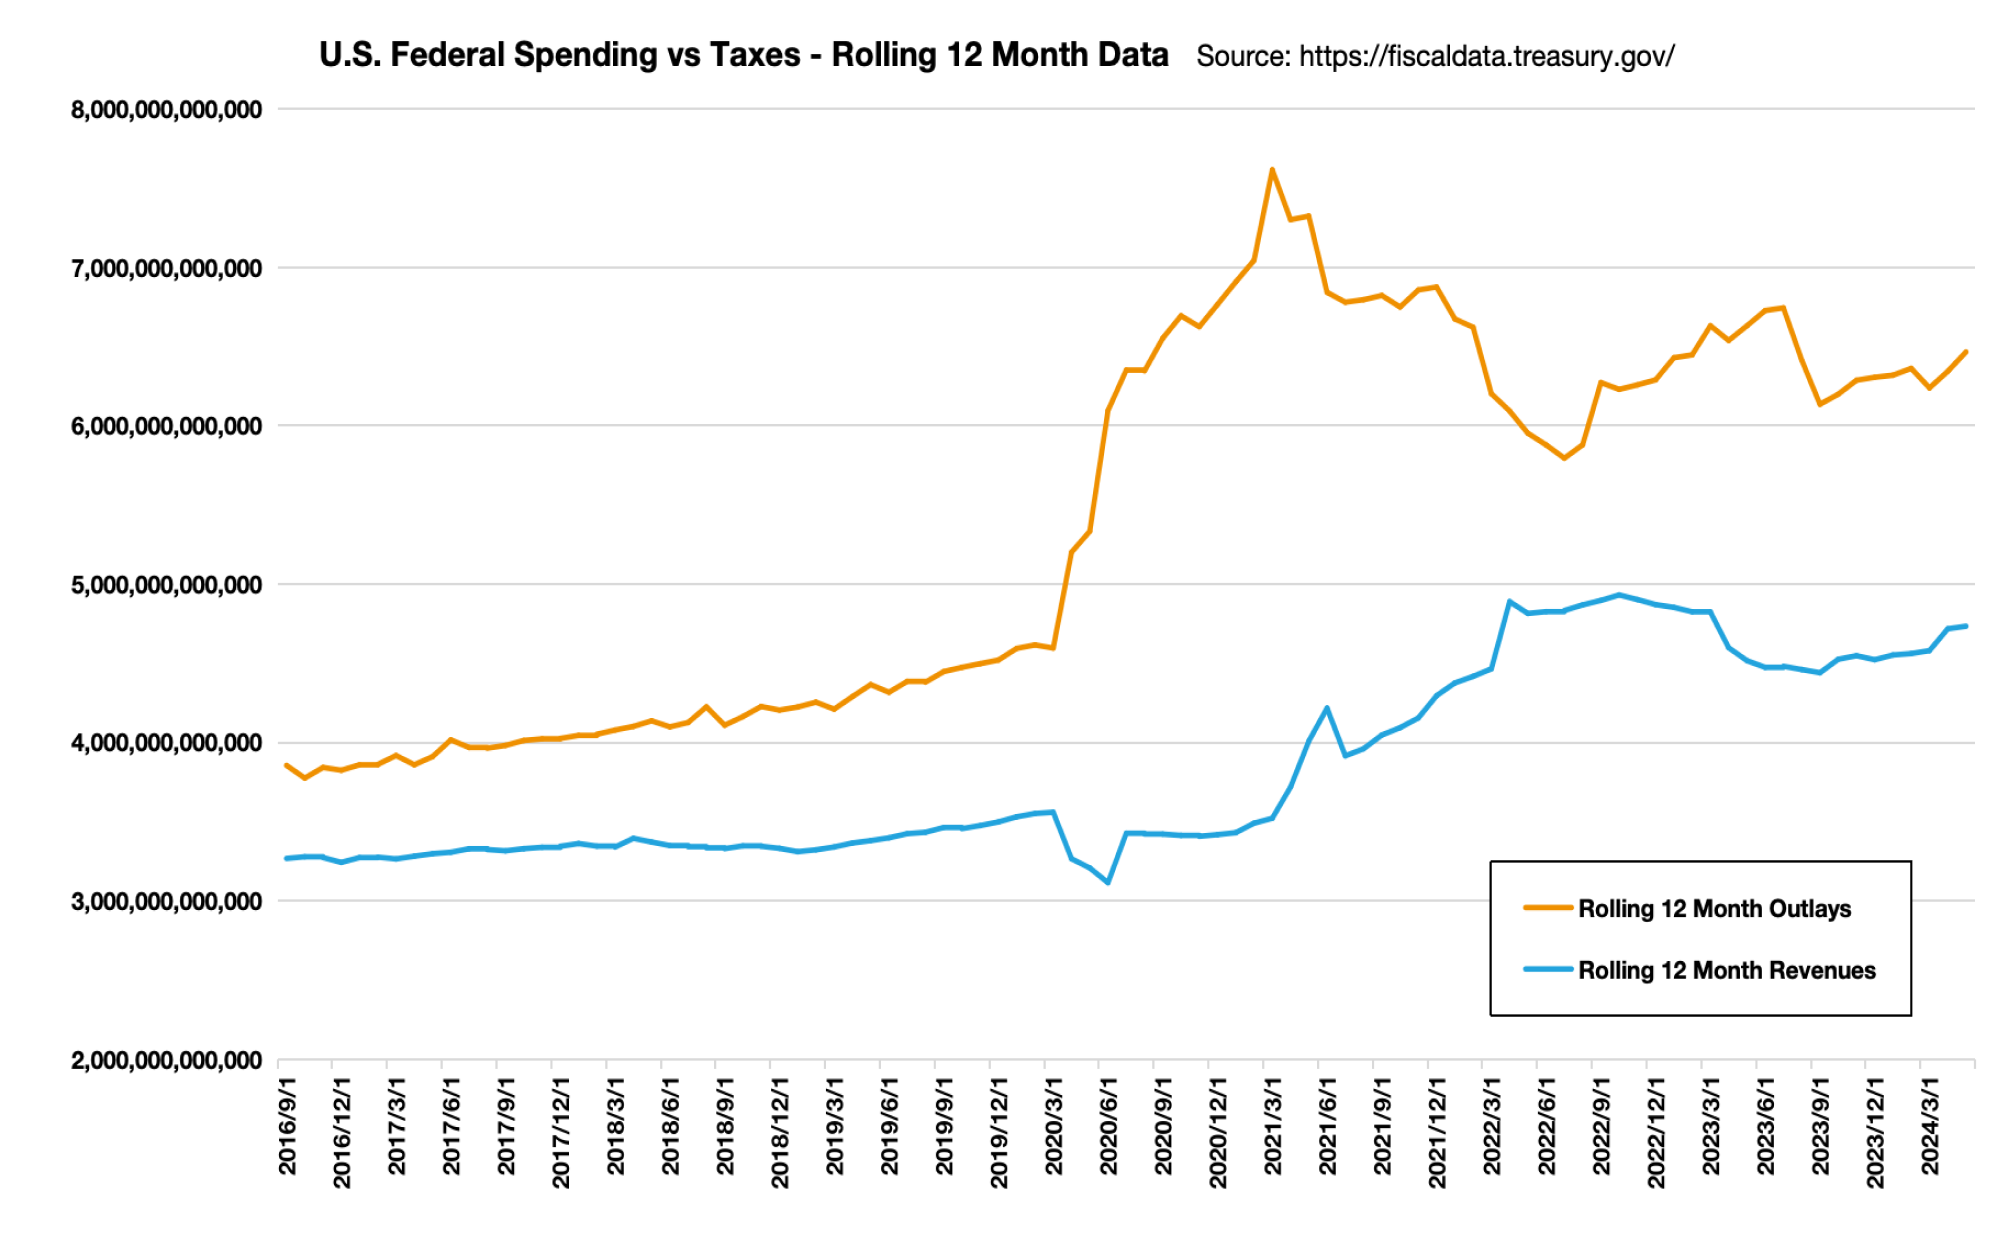
The chart below shows rolling 12-month historical spending in orange and tax revenue in blue for the U.S. federal government. Leading up to 2020, outlays and revenues were starting to gap meaningfully, sounding alarms for some watchdogs. But when COVID hit, deficit spending hit historical highs. The emergency spending did terrific things to help save lives and we would expect it to reverse after the crisis passed. Unfortunately, multiple years later, lawmakers seem to be punch-drunk and deficit spending has continued to stay high, with no serious discussion about addressing this issue.
Voters and especially leaders in the financial industry need to help to address this problem. The upcoming election would usually provide a great avenue to affect change, but our options seem limited this year. One presidential candidate speaks frequently about reducing taxes. Another presidential candidate wants to increase spending and to “forgive” more and more student loan debt. Both candidates seem very out of touch with the realities of budgets and the ever-growing debt problem. The longer fixes are postponed, the larger the pain will be for our economy.
Looking Forward
Stock market indexes are hitting all-time highs, which history often tells us is a wise time to shift portfolios into a defensive positioning, however, there are many reasons to continue to be bullish on equities. While we might hope that the federal government reins in deficit spending, there seems to be little hope for this to actually happen, so we expect high government spending and its short-term contribution to higher GDP to continue. Looking out at the next few years, interest rates are much more likely to go down than they are to go up, which we expect to be a factor in keeping price to earnings multiples high for stocks. The gap in Price to Earnings multiples between growth stocks and value stocks have been stretched to very high levels as A.I. related momentum has continued, making value stocks look increasingly attractive relative to growth stocks.
The presidential election is still four months away, but multiple sources are indicating that a win by the right is looking more likely. For investors who want to position their portfolios for a win by the right, a reduction in international exposure might be the most obvious move. New tariffs and other penalties for non-U.S. corporations have been discussed, which would be detrimental to profits for international equities.
Among bonds, we are continuing to maintain our duration underweight. The U.S. Federal Reserve has kept rates high and history shows that they tend to not make changes until they have a good reason (e.g. clear signs of a recession). With the shorter end of the yield curve continuing to pay higher yields than the longer end, we are holding on to our elevated shorter term bond allocations.
Important Disclosures
Opinions expressed are as of the current date; such opinions are subject to change without notice. Advyzon Investment Management shall not be responsible for any trading decisions, damages, or other losses resulting from, or related to, the information, data, analyses or opinions or their use. This commentary is for informational purposes only. The information, data, analyses, and opinions presented herein do not constitute investment advice, are provided solely for informational purposes and therefore are not an offer to buy or sell a security. Please note that references to specific securities or other investment options within this piece should not be considered an offer (as defined by the Securities and Exchange Act) to purchase or sell that specific investment or a recommendation for a particular product.
Performance data shown represents past performance. Past performance does not guarantee future results. All investments involve risk, including the loss of principal. There can be no assurance that any financial strategy will be successful. This commentary contains certain forward-looking statements. We may use words such as “expects”, “anticipates”, “believes”, “estimates”, “forecasts”, and similar expressions to identify forward-looking statements. Such forward-looking statements involve known and unknown risks, uncertainties and other factors which may cause the actual results to differ materially and/or substantially from any future results, performance or achievements expressed or implied by those projected in the forward-looking statements for any reason.
Investment management and financial advice offered by Advyzon Investment Management is intended for citizens or legal residents of the United States or its territories. Investing in securities involves risks, including but are not limited to; currency risk, political risk, geographic risk, concentration risk, custody risk, asset class risk, management risk, market risk, operational risk, passive investment risk, securities lending risk, tracking error risk, tax risk, valuation risk, and infectious illness risk. Investing in emerging markets may increase these risks. Emerging markets are countries with relatively young stock and bond markets. Typically, emerging-markets investments have the potential for losses and gains larger than those of developed-market investments. A debt security refers to money borrowed that must be repaid that has a fixed amount, a maturity date(s), and usually a specific rate of interest. Some debt securities are discounted in the original purchase price. Examples of debt securities are treasury bills, bonds and commercial paper. The borrower pays interest for the use of the money and pays the principal amount on a specified date. High yield debt (non-investment grade or junk bonds) can be more risky than higher rated debt, typically has a higher default rate than investment grade and treasury debt, and high yield funds can lose principal.
“SBBI” stands for “Stocks, Bonds. Bills, and Inflation”. “Stocks, Bonds, Bills, and Inflation”, “SBBI”, and “Ibbotson” (when used in conjunction with a series or publication name) are registered trademarks of Morningstar, Inc. ©2021 Morningstar.“CRSP” stands for Center for Research in Security Prices. Part of the University of Chicago’s Booth School of Business, the CRSP is a nonprofit organization that is used by academic, commercial, and government agencies to access information such as price, dividends, and rates of returns on stocks.
The indexes noted are unmanaged and cannot be directly invested in. Individual index performance is provided as a reference only. Since indexes and/or composition levels may change over time, actual return and risk characteristics may be higher or lower than those presented. Although index performance data is gathered from reliable sources, Advyzon Investment Management cannot guarantee its accuracy, completeness or reliability.